Can you be in STEM without math?
Math is the foundation of all STEM education. There – that’s my story and I’m sticking to it. But my assertion really needs to be thought through, because it is not obvious that higher-level math is necessary for every STEM degree. First, some definitions are in order: As a basic assumption for applying to college for a STEM major, I’m assuming that the student has completed, or will complete by high school graduation, as a minimum the mathematical coursework generally covered by the Common Core, or the National Mathematics Advisory Panel; in summary, sufficient math to start taking Calculus I as a college freshman. Remember, I said minimum – and not as a guarantee of admission; you can assume that not having taken calculus in high school will be a significant negative factor in admissions. Understanding Algebra, Geometry, and high-school calculus, along with a basic understanding of statistics, good grades in each, and a level of enjoyment are all important; it should set off alarm bells if a student says “I didn’t really enjoy math class” or even worse “I got good grades but I hated it”.
Higher-level math as a STEM major covers three major areas of math: Calculus and differential equations, statistics, and logic. The first is an essential aspect of engineering – a mechanical or civil engineer uses this for structural analysis, and the electrical engineering major must use differential equations for electromagnetic field calculations. Physics, biology, chemistry: all use calculus to analyze change, rate of change, and amount of change. For an idea of what the student will actually do in college, take a look at the MIT Open Course lecture series – in this lecture, an overview of differential equations and their application. This is why undergraduate STEM admissions look for a good track record in high school math: calculus, AP calculus if offered, and good ACT/SAT scores. In the paragraphs below you can read about applications of calculus in engineering and science disciplines.
Statistics are another significant tool in the STEM major’s kit. Because so much of the interaction with the real world involves approximation, inaccuracy, measurement error, and incomplete data series, statistical analysis is how scientist or engineer fills in the gaps in knowledge. And when you are tempted to draw a straight line through some data points, you are visually and mentally performing statistics. Even when the basis of a statistical calculation consists of a complete data series, the statistic can be predictive of future events. Later you can read about the application and importance of statistics in various STEM disciplines.
Logically, and recursively, decision analysis leads to good decisions. The mathematical tool kit for producing decision analysis builds on the foundation of early-schooling word problems and set theory such as Venn diagrams. Flowcharts which ask you to choose a path based on yes/no questions and logic charts which are constructed of and, or, and not questions are commonly used tools in everything from epidemiology to computer memory. An overview of the tools and their application is given below.
Pure math – proofs without numbers and the thought process
Pure Math
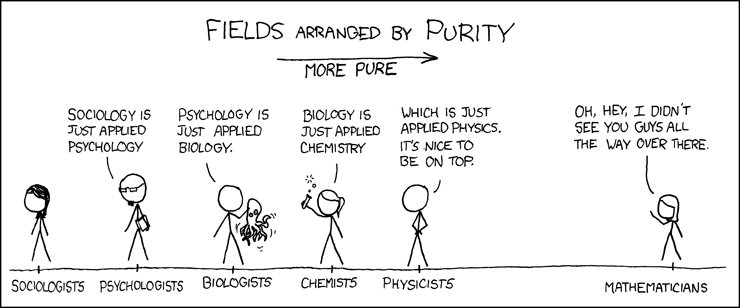
One of the ironies of math is that it can appear completely useless, from the standpoint of practical application, but yet be a rigorous and internally consistent science with theories to prove or disprove. Often considered the ‘purest’ STEM major, the discipline has produced some of the most important tools used in engineering and science education and professions; without algebra, geometry, and calculus, the physics of our modern world would be as mysterious and impenetrable as the Titans of Greek mythology. Many universities which offer Mathematics undergraduate degrees provide guidance such as: many academic and industrial positions open to mathematicians require training beyond a bachelor’s degree, students who intend to make mathematics their profession must normally plan to continue with graduate study. Having asserted that, the thought process developed by a rigorous undergraduate math major is a useful skill in further pursuit of computer programming and modeling.
Another path, one that drives towards the practical, is the undergraduate study of Applied Mathematics. This is an important field of study as it focuses, as the name implies, on applications of mathematics. Statistics and decision analysis are two areas of concentration for the applied math major, and the skills learned in an applied math curriculum are applicable to a wide range of engineering and science problems, such as computational fluid dynamics, fault-tolerant communications systems, oil refinery optimization, and actuarial science.
It might already be obvious to you (in which case you’re thinking like a mathematician) that there is significant overlap between math and applied math majors, and it is not unusual for a university to offer both degrees – with the former leading towards graduate studies and onward to research and academia, and the latter towards a career in a STEM field with heavy emphasis on quantitative methods. If a student is passionate about math, but unsure what to do with it, a program such as the UC Berkeley mathematics department that allows a declaration of major only after completing 4 or 5 undergraduate math classes: Multivariable Calculus, Linear Algebra, Differential Equations, and Discrete Mathematics.
Applications of math
The calculus and differential equations
At its core, and in layman’s terms, calculus consists of integrals and differential equations; the former is the calculation of the area inside a curve, and a differential is the slope of a tangent line on that curve.

The Fundamental Theorem of Calculus
What makes this important is that area and slope are both very useful representations of real-world physical phenomena – and thus allows the modeling, analysis, and prediction of the real world from mathematical models. Think about how important that is: if, say, we know the speed of a car and the distance to the edge of a cliff, we can predict how hard to press the brake pedal…WITHOUT actually running a few cars over the edge before we figure it out. Sizing electrical wiring, selecting the right I-beam for a bridge, and deciding where to build a dam – all made possible by the power of integrals and differential equations. Once a student gets into calculus they will start to see integrals all around them: filling a soda cup – integrating area over height. Driving to school – integrating distance over time. Differentials – the slope of a tangent – also pop up, like the height and distance of a lawn sprinkler or the departure angle of a baseball-pitching machine. Understanding the underlying math of the physical world is the first step in predicting outcomes based on calculation – an essential aspect of STEM education and practice.
Statistics and Big Data
There are as many jokes about statistics as there are jellybeans in a jar, with most of them centering on the idea that with the ‘right’ statistics you can prove anything. Statistics are broadly in two categories (and real statisticians would wince when they read that): descriptive and predictive. In descriptive statistics, an analysis of part of the data set can let the user estimate, with a calculated confidence, the content of the entire set. Let’s say you ask each member of your football team to weigh in, but one of them is out sick. Of the team members that weigh in, the average weight is 175, with minimum of 150 and maximum of 205. What about that missing player? You can be very certain (but not absolutely sure!) that their weight is between 150 and 205, and depending on the number of players, you could even state your certainty, say 99% certain.
Everything else about statistics is the predictive aspect: If I know this and that statistics about my data series, I can predict the likelihood of an outcome – the likelihood that a 0.325 batting average player will bring home three runs with players on 1st and 3rd. Or if I know the range of accuracy of metallurgy tests, the quantities needed to alloy 18% chromium and 8% nickel with a maximum of 0.1% carbon in iron to create a specific grade of stainless steel.
Here is an example of statistics, for application in biomedical testing and which is extracted from UC Berkeley class notes on Bayes’ Theorem: Suppose one person in 100,000 has a very rare disease for which there is a fairly accurate test. The test is correct 99% of the time when applied to someone with the disease, and is correct 99.5% of the time when applied to someone who doesn’t have the disease. What is the probability that someone who tests positive for the disease actually has the disease? As you can imagine, an understanding of the math has actual, and significant, consequences in this person’s world.
Big Data is a frequently used term, and gave rise to the Data Scientist job title. Both of these refer to the ability to evaluate and manipulate the entire data set rather than a statistical sample. This turns the descriptive aspects of statistics upside down: rather than describe a data series based on simplifying statistical parameters like mean and median, I can understand the entire data set. Massive arrays, created by gathering more and more data, allow the data scientist to look for patterns and predictions at a level more granular than was ever possible using traditional statistics.
Logic and decision analytics
Shakespeare wrote a basic statement of logic in Hamlet, Act III Scene I: “To be, or not to be…” which in mathematics would be “true, or not true”. Schoolchildren learn the concepts of Venn diagrams – with the term ‘union’ meaning ‘and’, while the term ‘intersection’ means ‘or’. With those three words – and, or, not – an entire language of logic can be built.
Let’s look at a practical example used in computer science. Think about logging into your email account. The logic might be “IF the email exists AND the password matches the email THEN login user”. Easy, right? What happens if the email exists but the password doesn’t match? Or if they match, but you’ve never used this particular computer? As you can imagine there are thousands of questions to be asked, each with an AND, OR, or NOT comparison, and mapping your way through the branches of these logic trees is a vital part of the study of computer science.

Decision tree: Choices, chances, and values
Decision analytics combines the branching logic of yes and no questions with the statistical likelihood of each result (how often is it a “yes”?) to help make well-founded decisions. A decision tree has nodes which are choices (decisions), chances (statistically determined outcomes) and values (the metric for valuing an outcome). A geoscientist could use a simulation using multiple variables governed by a lognormal distribution to forecast how much oil is in each part of an oil field, supporting a good decision on where to drill her next well. If the decision tree results in a cost and revenue for each outcome, that analysis is called the expected value.
Using different number base systems
The math used in logic is known as Boolean math; in Boolean operations, every variable is either a 1 or a 0. An important concept is that for n variables, there are 2n possible combinations of values; e.g. for 8 variables there are 256 uniquely different combinations of 1s and 0s. This means an 8-digit binary number can represent the decimal numbers zero through 255. Again our computer science student can use this math to determine every letter, number, and symbol that can be typed (or at least 256 of them!), using the commonly-applied ASCII table.

Boolean math operators and diagrams
Well, that takes care of binary (base 2) and decimal (base 10) but what about other types of numerical systems? In the movie The Martian, Matt Damon tries to communicate using a rotating pointer. But to get all 26 letter and some symbols in a circle would pack them too closely together. So he uses a base 16 numbering system known as hexadecimal – where the digits are 0-9 and the letters A,B,C,F,E,F … F in hexadecimal is the equivalent of 15 in base 10 numbers. So if you’re ever marooned alone on Mars, make sure you pack a hexadecimal ASCII table. And ketchup.